
Injection molding shrinkage is the reduction in size that occurs as molten plastic cools and becomes a solid part. Most shrinkage develops while the part is cooling inside the mold, but dimensional change can continue after ejection and, for some materials, for hours or days afterward.
Typical linear shrinkage for commonly molded plastics ranges from about 0.2% to 3.0%. Amorphous plastics such as ABS, PC, and PMMA generally have lower and more predictable shrinkage. Semi-crystalline plastics such as PP, POM, PA, and PBT usually shrink more because their molecular structure becomes more compact during cooling and crystallization.
Shrinkage is unavoidable in plastic injection molding. The practical goal is to predict the initial value, compensate for it in the mold, and keep the result stable from one production cycle to the next. That requires more than selecting a number from a material chart. Resin grade, wall thickness, gate position, packing pressure, cooling, fiber orientation, and measurement time all affect the final dimensions.
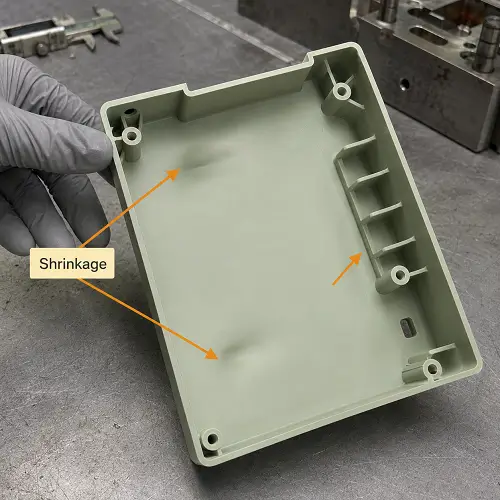
What Is Injection Molding Shrinkage?
Injection molding shrinkage is the dimensional difference between the mold cavity and the finished molded part. It is normally expressed as a percentage or as a linear value such as millimeters per millimeter or inches per inch.
Plastic occupies more volume when it is hot and molten than when it is cool and solid. As the temperature falls, molecular movement decreases and the material becomes denser. Semi-crystalline polymers undergo an additional change as more ordered and compact crystalline regions form during cooling.
The mold restricts free movement while the part is still inside the cavity. Packing pressure also pushes additional material through the gate to compensate for some of the volume reduction. Once the gate freezes—meaning the plastic at the gate becomes solid and stops additional material from entering—the remaining contraction can no longer be compensated through the gate.
Shrinkage does not always occur uniformly. If every area contracted by the same amount, the component would become slightly smaller while retaining its shape. In actual parts, differences in wall thickness, cavity pressure, cooling rate, flow direction, and material orientation produce different shrinkage levels. The result may be warpage, sink marks, hole movement, flatness problems, or poor assembly fit.
Plastic Shrinkage Rate Chart for Common Injection Molding Materials
The following values are typical linear molding-shrinkage ranges. They are useful for preliminary material comparison and initial mold design, but they do not replace the shrinkage value published for the exact production resin.
| Plastic Material | Typical Reference Range | Important Dimensional Behavior |
|---|---|---|
| ABS | 0.4–0.8% | Relatively low shrinkage and commonly used for housings |
| PC | 0.5–0.7% | Low shrinkage but sensitive to molded-in stress |
| PC/ABS | 0.4–0.7% | Commonly selected for dimensionally stable enclosures |
| PMMA | 0.2–0.8% | Low shrinkage; optical parts require stress control |
| PS | 0.3–0.7% | Low shrinkage but more brittle than ABS |
| PP | 1.0–2.5% | Higher shrinkage and greater sensitivity to cooling balance |
| HDPE | 1.5–3.0% | High shrinkage due to its semi-crystalline structure |
| POM | 1.8–2.5% | High but often predictable when processing remains stable |
| PA6 / PA66 | 0.7–2.2% | Strongly affected by grade, crystallinity, and moisture |
| PBT | 1.2–2.5% | Mold temperature has a strong influence on final dimensions |
| PPS | 0.6–1.4% | Glass-filled grades generally have lower shrinkage |
| PEEK | 1.2–1.5% | Applies mainly to unfilled grades; reinforced grades are lower |
These ranges are intentionally presented as references rather than fixed design values. Unfilled PA66, PA66-GF30, impact-modified nylon, and mineral-filled nylon do not use the same shrinkage allowance. The same applies to PP, PBT, PPS, and other material families.
Glass fiber normally reduces overall shrinkage because the fibers do not contract like the polymer around them. However, the fibers align with the direction of melt flow. Shrinkage parallel to the flow may therefore become much lower than shrinkage across it.
A reinforced plastic can have a low average shrinkage rate and still produce serious warpage. The exact reinforced grade and its flow-direction data should be checked before the mold cavity is finalized.
When Does Shrinkage Occur During Injection Molding?
Shrinkage develops across several process stages. It cannot be divided into one universal rule such as “80% inside the mold and 20% after ejection.” The distribution changes with material type, part temperature at ejection, packing conditions, wall thickness, cooling time, and mold geometry.
| Process Stage | What Happens | Dimensional Meaning |
|---|---|---|
| Filling | Molten resin enters and fills the cavity | No separate final shrinkage rate is normally reported |
| Packing and holding | Additional material enters as the plastic begins cooling | Packing compensates for early volume contraction |
| Gate freeze | The plastic at the gate becomes solid | No more material can enter the cavity |
| In-mold cooling | Temperature and cavity pressure continue falling | Most measurable shrinkage begins to develop |
| Ejection | The warm part leaves the mold | Demolding shrinkage can be measured |
| Cooling to room temperature | The part continues contracting in air | Included in the molding-shrinkage result |
| Post-molding period | Stress relaxation and post-crystallization may continue | Additional dimensional change may occur |
| Moisture conditioning | Hygroscopic materials absorb moisture | Materials such as nylon may expand rather than continue shrinking |
Filling and Packing
During filling, the machine pushes molten plastic through the nozzle, runner, and gate until the cavity is filled. The resin is hot, compressible, and under changing pressure, so a separate final “filling-stage shrinkage rate” is not normally reported.
Filling still affects the shrinkage measured later. Pressure is usually higher near the gate and lower at the end of the flow path. If the distant area receives less pressure and less material during packing, it may shrink more after cooling.
The packing and holding stage compensates for early volume contraction by feeding additional material into the cavity. Higher effective cavity pressure and sufficient holding time generally reduce final shrinkage because more material enters before the gate freezes.
The effect stops once the gate is solid. Extending holding time after gate freeze does not add more material to the part. A small gate may freeze early and leave a thick section under-packed even when the machine continues applying holding pressure.
In-Mold Cooling
After gate freeze, the part continues cooling but can no longer receive additional resin. The polymer becomes denser, pressure falls, and the part begins contracting against the cavity and core.
Most measurable molding shrinkage develops during this stage. The mold restricts movement, so different features do not contract freely in every direction. A box-shaped part may shrink tightly around the core while its outside surfaces pull away from the cavity. Ribs, bosses, side walls, and deep cores can therefore change how and where shrinkage occurs.
Cooling time also affects when the remaining contraction takes place. A part ejected at a high temperature undergoes more cooling and dimensional change outside the mold. Longer cooling leaves less immediate movement after ejection, although it does not automatically remove the material’s total equilibrium shrinkage.
Demolding Shrinkage
Demolding shrinkage describes the dimensional difference between the mold and the warm part immediately after ejection.
The measurement is useful for process monitoring. If the warm-part dimension or part weight changes during production, the packing, cooling, material condition, or machine settings may have shifted.
The immediate result should not automatically be treated as the final production dimension. The part is still cooling and is no longer supported by the mold. Flexible materials and semi-crystalline plastics may continue changing after they leave the press.
Molding Shrinkage and Post-Molding Shrinkage
Molding shrinkage is normally measured after the part has cooled and remained under defined conditions. Depending on the applicable standard or inspection agreement, measurements may be taken after 16, 24, or 48 hours.
This is the value most commonly compared with the shrinkage range in a material datasheet.
Post-molding shrinkage is the additional dimensional change that develops after the initial conditioning period. It can result from stress relaxation, physical aging, molecular reorientation, or continued crystallization. It is usually smaller than the initial molding shrinkage, but it can still affect gears, sealing features, connectors, long dimensions, and precision assemblies.
Total shrinkage includes both the initial molding shrinkage and the additional post-molding dimensional change.
For hygroscopic plastics, the final movement may not be a simple contraction. Polyamides can absorb moisture and increase in size after molding. That expansion may partially offset earlier shrinkage, but it also changes stiffness and mechanical properties. Nylon components intended for humid environments should not be approved only from a dry measurement taken immediately after production.
How Is Injection Molding Shrinkage Calculated?
The basic calculation compares the mold dimension with the final measured part dimension:
Shrinkage rate (%) = (Mold dimension − Part dimension) ÷ Mold dimension × 100
For example, if the corresponding mold dimension is 100.00 mm and the conditioned molded part measures 99.40 mm:
Shrinkage rate = (100.00 − 99.40) ÷ 100.00 × 100 = 0.6%
A 0.6% result does not mean every feature in the part shrank by exactly 0.6%. A long outside wall, an internal hole, a ribbed area, and a dimension across the melt-flow direction may produce different values.
When estimating the initial cavity dimension for a target part size, the calculation can be reversed:
Mold dimension = Target part dimension ÷ (1 − Shrinkage rate)
The percentage must be converted into a decimal. For a target dimension of 100.00 mm and an expected shrinkage rate of 0.6%:
Mold dimension = 100.00 ÷ (1 − 0.006) = approximately 100.60 mm
This calculation provides an initial cavity dimension. It does not automatically account for flow direction, restricted shrinkage, fiber orientation, local packing, mold thermal expansion, or warpage.
The same shrinkage factor should not be applied blindly to every surface in a reinforced or geometrically complex part. Critical holes, locating features, sealing areas, and assembly dimensions may need separate evaluation.
Amorphous vs Semi-Crystalline Plastic Shrinkage
Plastic structure is one of the main reasons different materials use different shrinkage allowances.
| Material Structure | Common Examples | General Shrinkage Behavior |
|---|---|---|
| Amorphous | ABS, PC, PMMA, PS, PC/ABS | Usually lower shrinkage and less crystallization-driven movement |
| Semi-crystalline | PP, PE, POM, PA, PBT, PPS, PEEK | Usually higher shrinkage and greater sensitivity to mold temperature and cooling |
Amorphous plastics contain polymer chains arranged without a large amount of ordered crystalline structure. These materials soften across a temperature range and generally show lower molding shrinkage.
Lower shrinkage does not make them immune to dimensional problems. High molded-in stress, uneven packing, unbalanced cooling, and premature ejection can still produce warpage or delayed movement. Transparent PC and PMMA parts need particular attention because internal stress can affect appearance, cracking resistance, and long-term performance.
Semi-crystalline plastics contain both amorphous and ordered crystalline regions. As these materials cool, part of the polymer structure reorganizes into denser crystalline areas. This creates additional volume reduction beyond ordinary thermal contraction.
Crystallinity means the formation of more ordered and compact regions inside the polymer. The amount that develops depends partly on cooling rate and mold temperature.
A colder mold may freeze the surface quickly while the center continues changing. A warmer mold may allow more crystallization before ejection, sometimes producing higher measured molding shrinkage but a more stable final structure.
The goal is not always to obtain the smallest possible measurement immediately after molding. The more useful target is a stable dimension after the part reaches the condition in which it will be inspected, assembled, and used.
Flow, Transverse, and Thickness Shrinkage
Plastic shrinkage can occur differently in three directions:
- Flow direction: parallel to the movement of molten plastic through the cavity
- Transverse direction: across the direction of melt flow
- Thickness direction: through the wall from one molded surface to the other
Unfilled amorphous plastics often show less directional difference than fiber-reinforced or highly crystalline materials. Direction becomes much more important when glass fibers, carbon fibers, mineral fillers, or strong molecular orientation are present.
During filling, fibers tend to align with the flow. This alignment restricts contraction in the flow direction more strongly than across it. A glass-filled nylon plate may shrink very little along one axis but noticeably more across the other.
Thickness shrinkage can also be much greater than in-plane shrinkage. The outer skin freezes against the mold while the hotter center continues contracting. This behavior contributes to sink marks and internal voids in thick areas.
Directional shrinkage is one reason a single global scale factor can fail on reinforced parts. Gate position changes the flow direction, and the flow direction changes fiber orientation. Moving a gate can therefore change final dimensions and warpage even when the resin and average shrinkage rate remain the same.
What Factors Affect Injection Molding Shrinkage?
Material and Resin Grade
The polymer family provides an initial range, but the commercial resin grade provides the useful design value. Flow modifiers, impact modifiers, mineral fillers, glass fibers, flame retardants, colorants, and recycled content can change shrinkage behavior.
A mold should not be finalized from a general note such as “PA66” when the production material will be PA66-GF30.
Wall Thickness
Thick walls cool more slowly and normally experience greater internal contraction. Thin walls freeze earlier and may receive less packing if the flow path or gate is restrictive.
Uneven injection molding wall thickness creates more risk than thickness alone. A thick boss attached to a thin cosmetic wall may shrink locally and pull the visible surface inward. A broad panel with uneven ribs may twist because different regions complete cooling at different times.
Packing Pressure and Holding Time
Higher effective cavity pressure generally reduces shrinkage because more material is packed into the part. The effect depends on whether pressure can reach the area before the gate freezes.
Excessive packing is not a universal solution. It can cause flash, difficult ejection, high residual stress, overweight parts, or stress concentrated around the gate. Packing should be sufficient and balanced rather than simply maximized.
Gate Size and Gate Location
A larger gate normally remains open longer and allows more packing. A gate that is too small may freeze before a thick or distant area receives enough material.
Gate location affects pressure distribution and flow orientation. Areas near the gate often receive more packing than end-of-fill regions. In fiber-filled plastics, the gate also influences how reinforcement aligns throughout the part.
Mold and Melt Temperature
Mold temperature affects cooling rate, crystallinity, surface replication, gate freeze, and residual stress. Its influence is especially important for PP, POM, PA, PBT, PPS, and PEEK.
A higher mold temperature may increase crystallization and shrinkage in a semi-crystalline plastic, but it can also produce a more stable internal structure.
Higher melt temperature increases the amount of cooling needed before the part reaches room temperature. It may also lower viscosity and delay gate freeze, allowing better packing. Because these effects work in different directions, melt temperature does not have one universal relationship with final shrinkage.
Cooling Time and Cooling Balance
Short cooling time leaves the part hotter at ejection, increasing the amount of contraction that occurs outside the mold. Longer cooling reduces immediate post-ejection movement but increases cycle time.
Cooling balance is often more important than cooling time alone. A part that is cold on one side and hot on the other may warp even if its average ejection temperature appears acceptable.
A Practical Shrinkage Review Before Tooling
Consider an equipment housing initially designed in ABS. The material is later changed to PA66-GF30 because the product requires greater stiffness and heat resistance.
The original ABS mold allowance should not be reused automatically. PA66-GF30 may have lower shrinkage along the fiber direction than unfilled nylon, but shrinkage across the flow can be higher. The gate position now affects fiber orientation, and fiber orientation affects both dimensions and warpage.
The material change also introduces different drying requirements, mold-temperature requirements, surface behavior, and moisture-related dimensional change. A tolerance that was realistic for the ABS housing may need to be reviewed again.
Before tooling release, the mold engineer should reconsider:
- Cavity compensation in each important direction
- Gate position and expected fiber orientation
- Wall-thickness transitions and rib layout
- Flatness and assembly requirements
- Mold temperature and cooling design
- Measurement timing and moisture conditioning
- Steel-safe areas that may require adjustment after T1
The material name changed in one line of the drawing, but the manufacturing conditions changed across the entire mold. This is why shrinkage review must follow the exact production grade rather than the general shape of the CAD model.
How Shrinkage Affects Tolerance, Warpage, and Assembly Fit
Shrinkage affects more than the overall length and width of a plastic part.
| Part Problem | Shrinkage Behavior | Typical Areas to Review |
|---|---|---|
| Overall part is undersized | Actual shrinkage is higher than the mold allowance | Resin grade, packing, mold temperature, cavity size |
| Warpage or twisting | Different areas or directions shrink by different amounts | Cooling balance, wall thickness, flow direction, fiber orientation |
| Sink marks | A thick local area continues contracting after the surface freezes | Ribs, bosses, pads, packing, gate freeze |
| Internal voids | The center of a thick section contracts without enough compensation | Wall thickness, packing, cooling |
| Hole or boss movement | Local shrinkage pulls functional features out of position | Core support, boss mass, gate position |
| Poor assembly fit | Critical dimensions do not shrink as predicted | Tolerance strategy, conditioning time, feature direction |
| Dimensional drift | The part continues changing after initial inspection | Post-crystallization, residual stress, moisture |
A uniformly smaller part normally indicates a difference between the assumed and actual shrinkage allowance. Warpage indicates that shrinkage is uneven by direction or location.
Holes may also behave differently from outside dimensions. Plastic surrounding a core pin can shrink tightly onto the pin while outside walls pull away from the cavity. Boss locations, snap-fit engagement, sealing lands, and connector pitch may therefore move in ways that a simple global scale factor cannot predict.
Shrinkage must be considered when setting injection molding tolerances. A tight tolerance may be realistic on a small, directly molded feature but difficult across a large panel or several flow directions.
How to Reduce and Control Injection Molding Shrinkage
Shrinkage cannot be eliminated, but its value and variation can be controlled.
Before Tooling
Confirm the exact resin grade and obtain its molding-shrinkage data. Identify the dimensions that control assembly, sealing, alignment, flatness, and appearance.
Review whether the drawing applies unnecessarily tight tolerances to non-critical features. The design should also be checked for uneven walls, heavy bosses, unsupported broad faces, and abrupt thickness transitions.
During Mold Design
Select cavity compensation based on the production material, part direction, and critical features. Gate location should support balanced filling, sufficient packing, and acceptable fiber orientation.
Cooling channels should follow the actual heat load of the part. Identical channel spacing does not always create balanced cooling when one area contains ribs, bosses, inserts, or thicker walls.
Steel-safe design can leave selected dimensions available for controlled adjustment after T1 measurements. This is often more reliable than attempting to predict every production dimension perfectly before the mold has run.
During Mold Trials
Use the intended production resin rather than a loosely comparable substitute. Record material drying, melt temperature, mold temperature, fill time, transfer position, holding pressure, cooling time, part weight, and measurement time.
Warm parts at the molding machine can be checked for process monitoring, but final approval should use the agreed conditioning period. If the drawing requires a 24-hour measurement, T1 dimensions should be evaluated after the same period.
The trial should confirm not only whether the part measures correctly, but also whether it remains stable after cooling, conditioning, assembly, and environmental exposure.
During Production
Once the process is approved, material condition and molding settings should remain within the validated process window. Changes in resin lot, recycled content, drying, packing, mold temperature, or cooling time may affect dimensions even when the mold remains unchanged.
Part weight is a useful production indicator. A change in weight may show that packing or material delivery has shifted before a dimensional problem becomes obvious.
Inspection timing and conditioning must also remain consistent. Comparing a warm part with a 24-hour-conditioned part creates variation that does not necessarily come from the molding process.
How Should Injection Molding Shrinkage Be Measured?
A useful shrinkage result needs more information than one percentage.
| Measurement Detail | Why It Matters |
|---|---|
| Exact resin grade | Different grades of the same polymer can shrink differently |
| Mold dimension | Provides the reference used in the calculation |
| Flow direction | Parallel and transverse shrinkage may not be equal |
| Conditioning time | Warm, 24-hour, and long-term dimensions may differ |
| Temperature and humidity | Affect both measurement and moisture-sensitive plastics |
| Molding conditions | Packing, mold temperature, and cooling influence the result |
| Measurement method | Flexible and thin features may need a fixture |
| Part orientation | Long or unsupported parts can move under their own weight |
ASTM D955 covers shrinkage measurement from mold dimensions for thermoplastics under specified molding and conditioning conditions. ISO 294-4 covers molding shrinkage and post-molding shrinkage parallel and normal to the melt-flow direction.
These standards improve measurement consistency, but a standard test plaque cannot reproduce every production component. A real part may contain ribs, bosses, curved surfaces, inserts, multiple gates, deep cores, and several flow directions.
Production approval should therefore use the actual component, production resin, approved molding process, and agreed conditioning method.
What Should Be Provided Before the Mold Is Built?
Shrinkage can be reviewed more accurately when the quotation includes:
- 3D CAD file
- 2D drawing with critical dimensions
- Exact resin supplier and grade
- Glass-fiber or filler percentage
- Expected production quantity
- Surface and flatness requirements
- Assembly and sealing information
- Operating temperature and moisture exposure
- Required conditioning or inspection standard
If the final material has not been selected, the intended part function should be explained. A cosmetic housing, gear, sealing component, snap-fit, and high-temperature connector require different material and dimensional strategies.
Providing this information before steel cutting allows the moldmaker to review cavity compensation, gate position, wall balance, cooling, fiber direction, steel allowance, and expected dimensional stability together.
Conclusion
Injection molding shrinkage develops while the plastic cools inside the mold and can continue after ejection. Material charts provide an initial reference, but the final dimensions depend on the exact resin grade, wall thickness, packing, gate freeze, mold temperature, cooling balance, flow direction, reinforcement, and measurement time.
Reliable dimensional control starts before the mold is built. Send JeekMould your 3D CAD file, 2D drawing, exact resin grade, production quantity, and critical dimensions. Our engineers can review shrinkage allowance, wall-thickness risk, gate and cooling strategy, tolerance requirements, and mold-adjustment options before tooling begins.